WISP Access Point Market Insights: Know Your Network

Title image for WISP Access Point Market Insights blog

WISP Access Point Market Insights: Know Your Network, Part 2

Welcome to the second installment of Preseem’s Know Your WISP Network blog series! This series brings you the latest data on the real-world experience of fixed wireless subscribers, networks, and equipment. Preseem’s Fixed Wireless Network Report relies on an extensive data set that features hundreds of real-world deployments across ISPs. By using the detailed metrics contained within the report, we’re able to bring you exclusive fixed wireless insights.

In our previous post in the Know Your Network series, we discussed a high level overview of the subscriber experience. We identified topics such as average vs. peak throughput, latency, and also download usage for fixed wireless subscribers. Continuing with our exploration of all things fixed wireless, we’ll focus now on examining WISP access point (AP) market insights.

During our examination of WISP access point market insights, we’ll uncover answers to the following questions:

  • What’s the access point market share by count of APs?
  • Similarly, what’s the access point market share by subscriber count?
  • Which access point model is most prominent?
  • Also, which AP model maintains the greatest number of subscribers?

Access Point Market Share by Count of APs and Subscribers

To gain a comprehensive view of the AP market share, we compiled data based on two metrics. The first metric measures access point market share by looking at the number of APs per provider. The second metric frames each provider’s market share on the basis of subscriber count. The figures below summarize the results of this comparison.

Pie charts showing access point market share by AP count

In both cases, it’s clear that the leaders are Cambium and Ubiquiti. Nevertheless, while Ubiquiti maintains the largest share of access points (51.9%), Cambium serves the largest number of subscribers (46.6%).

On the surface, it may seem odd that the provider with the greatest share of APs does not also host the largest number of subscribers. Put simply, Cambium is able to host more subscribers across a smaller number of access points due to the types of AP models it uses. For instance, the Cambium PMP 450m device comprises only 1.7% of the AP market, yet it constitutes 9.54% of the entire market’s subscriber count.

This proves that only looking at the number of access points or subscribers does not provide a holistic depiction of the entire market. This is precisely why we decided to also compile data based on the type of access point model being used.

Access Point Model Market Share by Count of APs and Subscribers

Gaining an overview of AP market share gets more complicated when considering the different types of AP models being deployed. We split the data into two sets to measure metrics based on both AP and subscriber count. By viewing the data across these two domains, access points that support a large number of subscribers are easily spotted. The following graphs exhibit the results of this investigation.

Graphs showing access point market share by count of APs and subscribers

It’s evident that the Rocket Prism 5AC Gen2 access point is not only the most popular AP model used, but also the one with the largest subscriber count. It’s interesting to see that many AP models, such as the ePMP200 and the PMP 450m, support a subscriber count that is more than 3% greater than their AP model market share. These results suggest that a small number of access points can support many subscribers, depending on the model of AP used.

See how organizations within the fixed wireless industry are already using the subscriber insights contained in this year’s report by reading this Telecompetitor article.

Are you interested in seeing other fixed wireless insights?

Preseem’s Fixed Wireless Network Report contains over 30 fixed wireless figures spanning across 26 pages. Best of all, it’s free!

Where Do the Minutes Go on a Tier 1 ISP Support Call?

A subscriber calls because the internet has been dropping out every evening, and your agent starts the call already behind. They open the account in billing, then the subscriber's radio or ONT in the vendor's portal, then the ticket history, and run a test against the CPE while narrating the wait to someone who was already annoyed when they dialled. That's often how a technical call runs in Tier 1 ISP support: much of it goes to searching, and the conversation fits in around it.

A seasoned agent knows which systems to open and in what order, but still has to open them, because the subscriber's experience, the state of the shared asset and the history of the account are stored in different places. As Wi-Fi or the Network? set out, each check answers part of the question and sends the agent somewhere else for the rest, so the difficulty lies in where the evidence lives rather than in the person reading it. When the call runs out before the answer arrives, the subscriber gets a callback, an escalation or a reboot script that may not address the fault.

Why Is One Agent Doing Two Jobs on Every Call?

Every technical call holds two jobs. One is finding the answer: gathering evidence across systems, comparing this subscriber with their neighbours and deciding where the fault is. The other is handling the person: listening and empathizing with what they've been living with, explaining what's wrong in terms they recognize and telling them what happens next. They're different skills, and on today's desk one agent does both at once.

On the evening-dropout call, the investigation takes the agent's attention first, because there's nothing to explain until it's done. The subscriber listens to typing while the agent moves between portals, and if the answer arrives after they've hung up, the explanation never happens, and the ticket moves to Tier 2. Repeated across a day, that's the reactive load that keeps ISP support teams stuck in firefighting mode.

What Does Tier 1 ISP Support Need on Screen to Close the Call?

Four pieces of evidence, read together:

The What Tier 1 Needs

Where It Usually Lives Today

What It Helps Determine

The What Tier 1 Needs

The subscriber's experience over the window they're describing (latency, packet loss, throughput against their plan)

Where It Usually Lives Today

A QoE system, if the operator collects it at all

What It Helps Determine

Whether the problem the subscriber describes actually happened, and when

The What Tier 1 Needs

The asset they sit on, and how other subscribers on that AP, sector or PON did over the same hours

Where It Usually Lives Today

The network management system, or one portal per radio and OLT vendor

What It Helps Determine

Whether others on the same asset were affected at the same time, which points to a shared issue

The What Tier 1 Needs

Has a problem that's in your network

Where It Usually Lives Today

The radio or OLT vendor's tool

What It Helps Determine

Whether the drop to the home is healthy, which narrows the search without placing the fault inside the home

The What Tier 1 Needs

What was tried on this account last time

Where It Usually Lives Today

The ticketing system or CRM

What It Helps Determine

Which steps not to repeat

None of these settles the question alone. Identifying an in-home Wi-Fi problem takes evidence from behind the CPE, and neighbours degrading at the same hours points to a shared issue without naming its cause. With all four in one view, an agent can reason through the diagnosis and explain what the evidence points to as they go, but reading them together mid-call is still the investigation, just done faster.

How Does an AI Support Assistant Get the Answer on Screen?

Preseem's Support Assistant, part of Preseem Plus, does the troubleshooting itself. Once the call is tied to a subscriber, it works through the same evidence an agent would chase across systems: the subscriber's experience over recent days, the other subscribers on their AP, sector or PON, the history of their radio or ONT, and the tickets already on the account. It gives the agent the cause and the next action in plain language, including whether the fault is in the home or on the network, and where, along with the evidence that places it there.

On the evening-dropout call, the agent opens the account and sees the pattern laid out: the subscriber's latency and packet loss climbing from around 7 p.m. on each of the evenings they described, their radio link healthy throughout, the other subscribers on the same sector showing the same pattern over the same hours, and the sector running at capacity while it happens. The assistant reads those together and places the problem on the shared sector as evening congestion, then routes it to the network team with that evidence attached. That reading is what it adds beyond four sources on one screen, since the agent isn't the one left to work out whether a healthy link and degraded neighbours add up to congestion.

The agent doesn't need another round of checks; they square the answer with what the subscriber is describing and act on it. Because the Support Assistant works alongside the agent, a person who knows the subscriber and the network sees its answer before the subscriber does, which is what separates an assistant from a tool placed in front of the subscriber, as covered in what AI actually does in ISP customer support.

What Does the Agent Tell the Subscriber?

With the investigation done, the rest of the call focuses on the subscriber. The agent can tell them that their own connection and equipment are fine, that the slowdown they've been seeing is on the part of the network they share with their neighbours and happens when it's busiest in the evening, and that it has been escalated to the network team with the evidence attached. Then comes what happens next: when they should see a change, that nobody needs to visit, and how they'll hear back.

The agent also has time to listen. If the subscriber mentions that the dropouts happen on weekend mornings too, that doesn't fit an evening congestion pattern, and an agent who isn't juggling portals can hear it, ask about it and check it against what's on screen before the call ends.

How Much Shorter Do Calls Get When Tier 1 Has the Answer?

Among Preseem customers using the Support Assistant, we've seen call times fall from over 30 minutes per call to under five. Read it as an indication of what's possible rather than a benchmark for your desk; your own call mix and network will shape where you land.

What Happens Next Once Tier 1 Has a Diagnosis?

A diagnosis on the call leads to one of three outcomes, and only one resolves the issue before the subscriber hangs up. When the assistant places the fault inside the home, the agent can often fix it with the subscriber on the line by moving the router or switching a device to a wired connection. Where the home network itself is what's holding the subscriber back, such as an ageing router or Wi-Fi coverage that doesn't reach the rooms they use, the agent can also offer a managed router service, so the operator looks after that part of the connection from then on. When it points to a fault on the shared network, as on the evening-dropout call, the ticket goes to the NOC with the fault confirmed. When it points to the subscriber's own link, a technician goes out with the fault already located.

The second and third outcomes still leave work for someone else, but they change what that work is. A call that runs out before the cause is found often escalates as little more than a description of symptoms, and Tier 2 or a network engineer starts the investigation again from scratch. With the diagnosis and its evidence attached, they start from the finding, and that's the metric for a support leader to watch: how many tickets reach Tier 2 needing the investigation started over. The engineers who would otherwise rerun it are often the same people planning upgrades and building out new areas, so each investigation they don't repeat is time back on that work. For how this fits with first-contact resolution, ramp time and the rest of the desk's numbers, see the complete guide to improving ISP support performance.


Take A Tour:

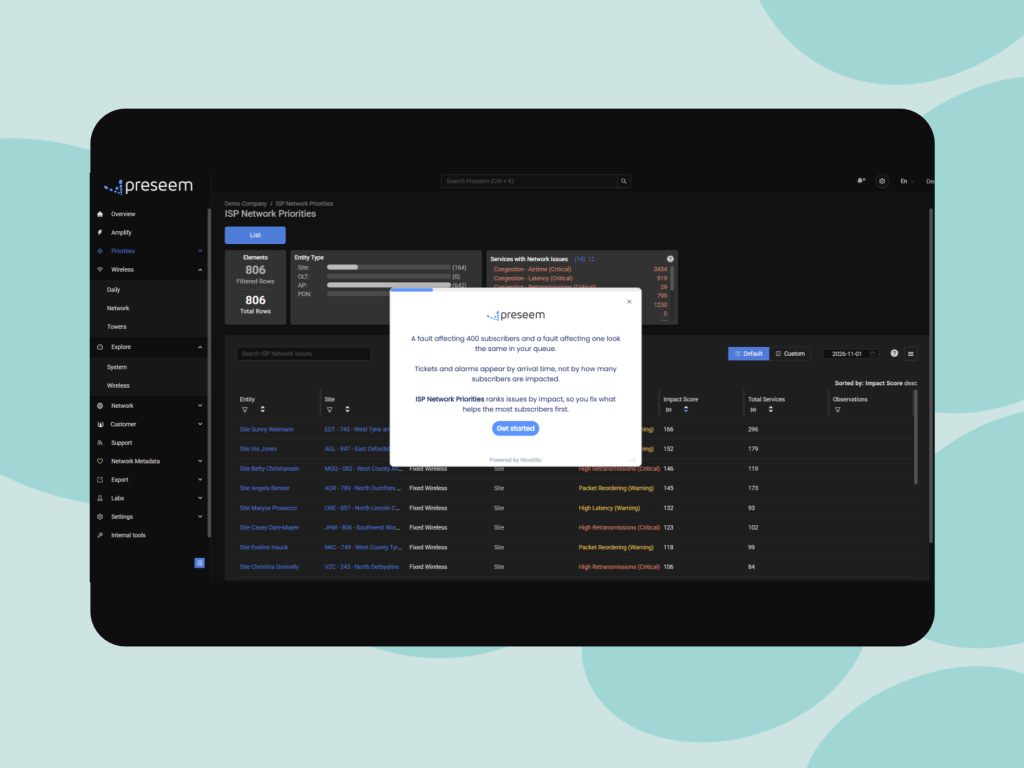
ISP Network Priorities

Explore how Network Priorities ranks network issues by subscriber impact, helping you focus on the fixes that make the biggest difference.

Take A Tour:

Support Assistant

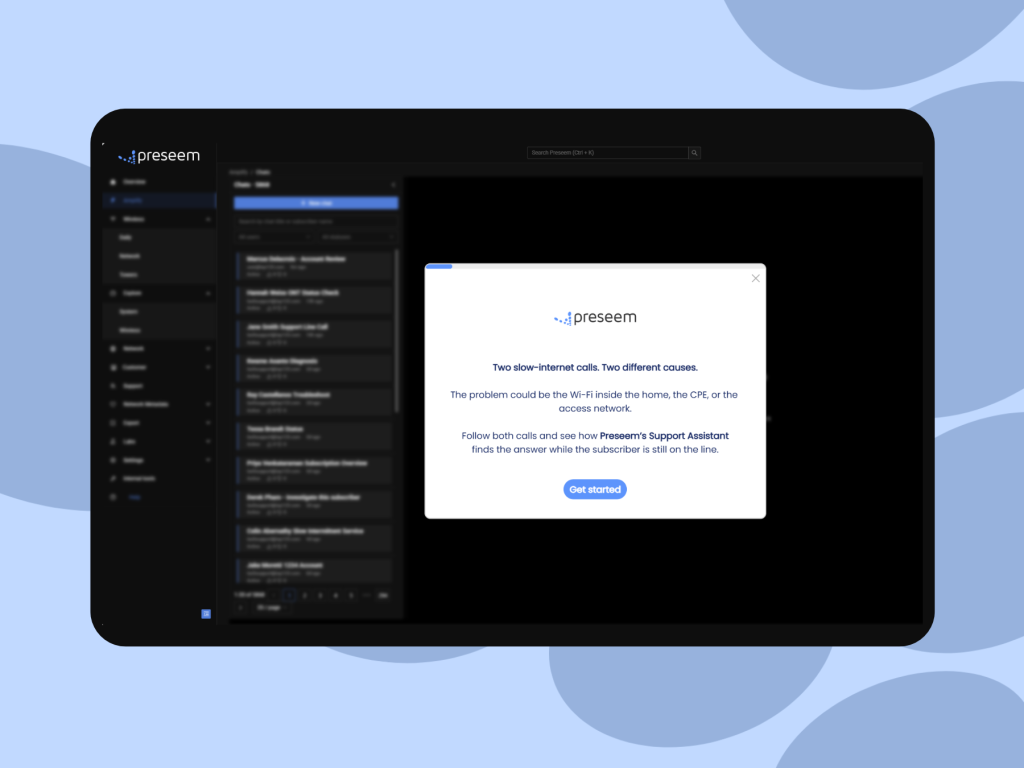
See the Support Assistant in action! 

Frequently Asked Questions


When should a Tier 1 ISP support call escalate?

A call should escalate when the fix needs something Tier 1 can't do: a configuration change on the network, a field repair, or a fault the NOC has to work. An escalation made because nobody could identify the cause in time is the easiest kind to recover, since the information needed to settle it often already exists in the operator's systems. Sort a month of escalations into those two groups and you'll see how much of your Tier 2 load is diagnosis rather than repair. The ISP support performance guide covers the escalation measures that sit alongside it.

Is an AI support assistant for ISPs just a smarter knowledge base?

No. A knowledge base holds procedures that apply to any subscriber, while an assistant connected to network data works out what's wrong with this subscriber's connection today. The knowledge base still has a place, because it's where the steps for a router reset or a plan change live once the cause is known. What it can't do is locate the fault, which is why an agent working from articles alone ends up troubleshooting by elimination.

What does AI agent assist need from a broadband network?

It needs per-subscriber experience measured continuously, a map tying each subscriber to the AP, sector or PON they sit on, access-link telemetry from the radio and OLT vendors you run, and the account's ticket history. To place a problem inside the home rather than just rule out the access link, it also needs evidence from behind the CPE. The topology map is easy to overlook, and without it a tool can't compare a subscriber with their neighbours, which is how a shared fault is told apart from a single one.

What if the subscriber doesn't accept the help desk diagnosis?

Show them the evidence in terms of their own experience: the drops on the evenings they described, or the fact that their neighbours on the same sector saw the same thing. A help desk diagnosis is much easier to accept when it matches what the subscriber lived through, and an agent with the answer already on screen has time to make that connection instead of reading a conclusion off a script.

About Preseem

Preseem shows regional ISPs what every subscriber is actually experiencing, from the network into the home and across every major equipment vendor. Operators use it to improve subscriber experience and business results together: keeping subscribers happier for longer, running a more efficient operation at lower cost, and earning more from upgrades and services subscribers want. Preseem turns that intelligence into next steps for support, the NOC and sales, aimed at whatever helps the most subscribers. Support Assistant gives the rep on the call the cause and the next action in plain language, including whether the fault is in the home or on the network. Network Priorities ranks the sites, APs and PONs to fix first by how many subscribers each one is degrading, and Service Priorities shows which subscribers to contact and whether to fix something or offer an upgrade. Expert view keeps two years of history behind every subscriber, AP and OLT. Learn more at preseem.com.

[/et_pb_post_content][/et_pb_column][/et_pb_row][/et_pb_section]

Latest From Our Blog

Network insights, best practices, and product updates to help you get the most from Preseem.
Amplify AI: Preseem’s Support Assistant

Amplify AI: Preseem’s Support Assistant

Discover Preseem’s Amplify AI: Support Assistant, an AI-powered tool that helps ISPs diagnose subscriber issues faster, reduce escalations and truck rolls, and resolve support calls more efficiently.

STOP MANAGING COMPLEXITY

START RUNNING YOUR BUSINESS

Every week without visibility is another week of trucks that didn't need to roll and subscribers who left without telling you why.

Let's start with your network, your vendors, your subscribers.