The Ongoing Evolution of Preseem
This blog takes a look at the evolution of Preseem and how we continue to refine our QoE monitoring and optimization metrics.
Preseem’s Quality of Experience (QoE) monitoring and optimization metrics, like TCP Round Trip Time and Retransmission, help identify where problems occur in WISP networks. By using Preseem, WISPs can understand where and when network bottlenecks occur.
That’s great, but the next step in Preseem’s evolution is figuring out why these problems occur in the first place. To accomplish this, Preseem relies on the billions of metrics captured in its dataset and advanced algorithms. And the first step of this process is already underway!
Prefer watching a video? If so, click here to watch Gerrit Nagelhout, CEO of Preseem, walk you through our evolution in just 10 minutes!
The Preseem QoE Monitoring Evolution
In October 2019, we released our Access Point (AP) Comparisons feature. This allows WISPs to see how their APs are performing relative to their peers. This AP comparison combines real-world performance metrics from Preseem’s customer base, allowing WISPs to identify under-performing or overloaded APs.
In February 2020, Preseem began collecting and analyzing metrics directly from APs via SNMP and other interfaces. These metrics have made it even easier for WISPs to identify the root cause of AP-related QoE problems.
These metrics include Frame Utilization, Multiplexing Gain, RF Packet Drop, and RF Packet Retransmitted for Cambium APs. For Ubiquiti APs, we track Airtime, AirMax Capacity/AMC, and AirMax Quality/AMQ.
Diagnosing Network Latency and Access Point Capacity Issues with Preseem
The diagram below shows some of the metrics that Preseem collects from APs. In this case, we’re looking at a Ubiquiti Rocket 5AC PTMP AP.
The top chart shows the average latency of all subscribers on the sector, the middle chart displays the airtime, and the bottom chart shows the downstream bitrate.
The orange line on the bottom chart indicates the typical downstream bitrate that Preseem expects from this AP. This is based on performance data that Preseem has collected from other Ubiquiti Rocket 5AC PTMP APs. When looking at the downstream bitrate, we can see that there’s room for improvement as the AP appears overloaded.

Looking at the middle chart, while airtime generally follows throughput, the data we see here shows no issues. Instead, where the problem becomes apparent is in the top chart, showing latency. Here, the spike in latency, together with reduced throughput, immediately tells us the AP is underperforming. As a result, we can conclude that interference was the cause of the jump in latency.
In this case, knowing why the problem occurred allows you to make an informed decision about how to fix it. For instance, simply changing the channel and upgrading to an AP that could better handle noise, like the Ubiquiti Rocket Prism 5AC Gen2, resolved the issue.
Understanding and Improving Subscriber QoE
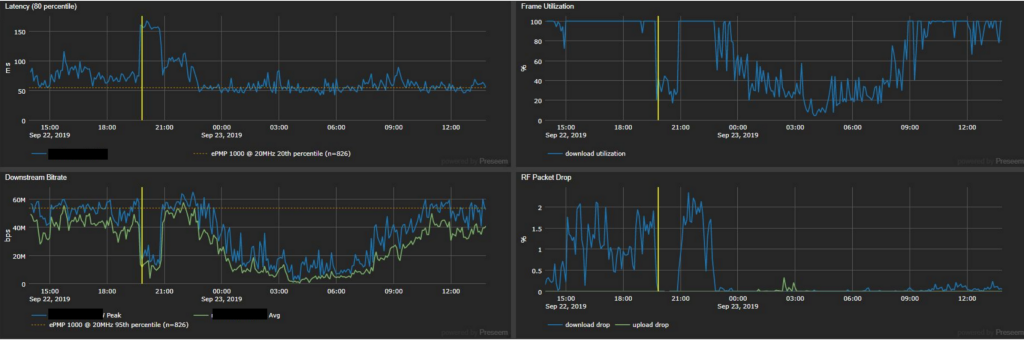
The above graphs show some of the metrics Preseem collected on a Cambium ePMP 1000 AP, and will help us understand why subscribers are experiencing poor QoE on this network.
Starting with the graph on the top left, we can see that latency is elevated. The chart on the lower left shows downstream bitrate. The orange line indicates the typical downstream bitrate of other Cambium ePMP 1000 APs. In this case, the downstream bitrate levels initially appear close to the orange line, indicating good performance. However, the chart on the top right shows frame utilization to be at 100%! Moreover, on the bottom right, the chart shows that the AP is dropping packets.
Now let’s take a look at the vertical, yellow line on each graph. This line indicates the point at which there were network backhaul issues for about an hour. You can see that, during this time, latency increased significantly. At the same time, downstream bitrate, frame utilization, and RF packet drop all decreased substantially.
These metrics indicate that an underlying backhaul problem was the root cause of this network’s poor QoE performance.
Looking Ahead: The Next Step in the Evolution of Preseem
Preseem’s QoE monitoring and optimization metrics have long enabled WISPs to detect and correct problems in their networks. Also, Preseem’s contains real-world AP comparisons and the ability to collect and analyze metrics directly from APs. This makes it easier for WISPs to recognize issues and also understand why they’re happening. And yet there’s still more to come from Preseem!
We expect to make Preseem even better by pulling in subscriber module information and presenting it in an easily comprehensible, actionable format. In addition, we’re looking at expanding the existing AP Score we provide by including more factors in it for consideration. This will save you the time of having to figure out all of the details by yourself.
We’re also planning on creating a Subscriber Score, giving you proactive insights into subscribers that are experiencing issues on your network. With these upgrades, and even more in the pipeline, Preseem will continue to be the premier QoE monitoring and optimization solution for WISPs!
Interested in adding Preseem’s QoE Monitoring and Optimized Shaping to your network? Try Preseem today for free!