In a previous blog post, we wrote about the analogy of medical telemetry to network telemetry. We also looked at how telemetry solutions should offer metrics at a high granularity (specific) and at short intervals (frequent). In this post, we’ll look at which network telemetry data can measure subscriber quality of experience (QoE).
Different Layers of Network Telemetry
Telemetry as a concept is useful at all layers and levels of the network.
Application-layer telemetry is becoming the norm in the micro-service world, thanks to systems like Prometheus. These can provide detailed insight into the behavior of live systems and also how they interact with other systems. For example, one of our services tracks the latency to Google Datastore for every query. And there are a lot of queries!
Looking a layer lower, one could imagine a telemetry solution that provides insight into the behavior of network-specific applications such as OSPF or BGP. This could include tracking the time required for each routing table computation. It could also track events for each new route that’s installed or simply the CPU and memory usage for these specific processes.
At the network data plane, telemetry solutions could provide insight into queue depth, interface drops, fabric drops, forwarding table changes, etc. Many of these change too quickly to observe with polling at longer intervals.
With perhaps the exception of the application level, all of the above can be considered types of network telemetry. But notice that they provide insight into particular points in the network, i.e. aspects of individual nodes or devices. Insight at these levels is very important for optimization and debugging. However, it provides limited insight into what actually matters, which is the network’s performance from the user’s point of view.
How to Optimize Your Network for Subscriber QoE
The purpose of the network is to deliver data to its users. Detailed insight at any particular node in the network, however, doesn’t provide the end-to-end picture of how your customers experience the network. To understand and optimize your network as experienced by subscribers, there are three network metrics that matter most:
- Throughput
- Latency
- Loss
These conceptually simple metrics can largely capture the network’s performance. Of course, like any other type of telemetry, the value of the metrics is directly related to the granularity and frequency at which they’re measured. A network telemetry solution that doesn’t measure by individual users can’t provide insight into subscriber QoE.
Also, it’s extremely important to understand the statistical distribution within each of these network metrics to truly understand network performance.
Understanding Network Performance
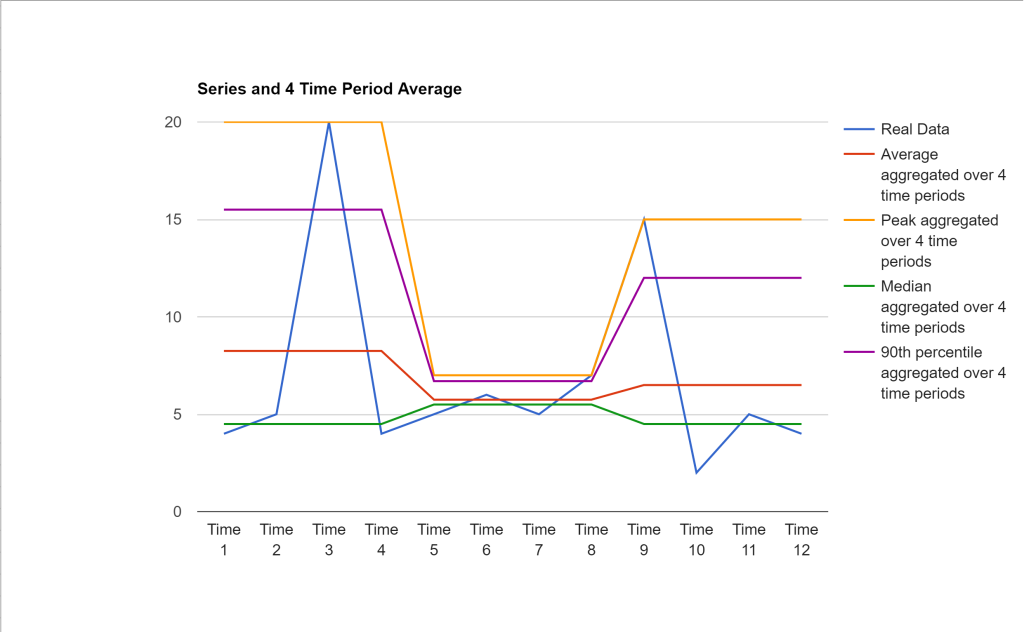
Jitter, or latency variation, is a familiar concept to many networking people. What’s less well known is the requirement to understand the variation found in these other network metrics. In a future blog post, we’ll talk more about this concept but for now, consider the chart below.

The chart above shows three different views of the data. The blue line is the actual metric samples taken from the network. Look at the red line, however. This shows the average over four intervals.
This type of averaging is very common in network monitoring solutions and is implicit in long sample periods (e.g. 5m, 1m). Notice the drastic difference between the blue line and the red line at time 3. By only looking at the average, you’d think the network has a lower utilization than is actually the case. Plotting the distribution or additional percentiles helps show what’s really happening in your network.
Network telemetry is a powerful concept that can improve understanding, debugging, and optimizing your network.
That said, it’s also important to keep in mind that delivering data to users is the network’s goal. Measuring network metrics related to individual network elements can contribute to debugging and optimization. However, this offers little insight into the performance of the network as experienced by its users.
To explore the power of network telemetry in your wireless operations, sign up for a free Preseem trial.


